Laura Matter – Garden Hotline Educator
Just because you love to play in the dirt doesn’t mean you can’t also be computer savvy. Did you know there are a number of useful tools available online to help you map and anticipate climate, rainfall, frost dates and more for your gardening area? These tools can help you have a successful garden by helping you reduce water use and plant or protect at the right time to minimize stress on your plants.
Climate Zone Maps
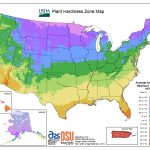
USDA Plant Hardiness Zone Map
Most seasoned gardeners know that the USDA has been providing a climate zone hardiness map for many years. The map is based on average extreme winter temperatures per climate zone in North America, which can help you plan which plants can survive the winter in your area. Though there were similar maps available in the 1920’s, including ones developed by the Arnold Arboretum at Harvard University in Boston, the first official USDA map was developed in 1960 by Henry Skinner, then Director of the National Arboretum. He developed a map dividing North America into ten climate zones that varied by 10° F of plant hardiness incrementally. This map has been updated over the years, especially in 1990 with a major update that subdivided each numbered zone into “a” and “b” zones of 5 degree increments—added to reflect the acknowledged changes in climate being seen at that time. The most current iteration was updated in 2002 in conjunction with the American Horticultural Society to reflect even more changes in climate. Two new zones were addedncluding their “a” and “b” subdivisions, for a total of 12 climate zones. Where the original 1960 map reflected 40° F as the highest extreme average winter temperature, the newest map now shows 70° F as the highest extreme average winter temperature measure. Due to the political controversy of climate change science, the updated map did not become public for another 10 years, finally becoming available for use in 2012. To learn more about the history of these maps and science visit the following sites: Bill’s Garden and Arnold Arboretum.
To use the map visit the USDA Plant Hardiness Zone Map. There is a static map page and an interactive map that can pinpoint to your zip code and give you finer details including microclimate information. Some areas of your greater neighborhood or geographic region may exhibit a different sub zone designation than your garden. These differences can be caused by a large hillside that deflects the prevailing wind, a lower topography than surrounding areas that can create colder air at ground level, a large body of water that could mitigate frosts, and other local topographical features to the site. Downloads of the USDA maps are available at the link above for your reference as well as some good, solid information about microclimates and how they affect gardening. Knowing your zone designation empowers you with knowledge when you are looking at plant labels and trying to determine if a prospective plant will thrive in its intended future home; most plant growers use the USDA zone information as reference on their labels.
Sunset Western Garden Climate Zone Maps
Sunset, well-known publisher of the popular garden book for west coast gardeners, developed maps to enhance the use of the USDA plant hardiness maps. Their maps take into account more than just average extreme winter low temperatures, also measuring other climate factors such as the length of a growing season; timing and amount of rainfall in an area; summer highs and winter lows; wind; and humidity. Their maps have many more subdivisions indicating the more actual microclimates associated with our very versatile geography in North America. What is considered Zone 8b on the USDA map for the Seattle area is considered Zone 5 on the Sunset map. Their description of this zone includes references to our maritime climate, a definite influence on how our gardens grow. To use the map and access information for western Washington climate zones visit: Sunset Climate Zone Maps.
Real-Time Weather Maps
Soil Temperature
Knowing your soil temperature allows you to be informed about when it is time to set particular plants out into the garden. It also lets you know if the soil is too cold to be worked. This is especially true for vegetable gardens. Working soil when it is too cold is structurally damaging to the soil and certain food crops, like peppers and basil and tomatoes, prefer soil temperatures to be in the 60° F range for optimum growth. You can check on soil temperatures to see if they have become warm enough to plant your tomatoes out without damage.
Air Temperature
Of course you need to take air temperature into account for planting and may need to provide a cloche for your heat crops even when the soil temperature is adequate. Knowing the air temperature will not just help you plan when to set plants out, but also let you know if the day or week is going to become too hot for a cloche or certain crops. Though it’s not typically a problem in the Pacific Northwest, tomatoes and peppers will slow production when temperatures spike and remain above 90o F. Common early season crops like pac choi and spinach will bolt (go to seed) when air temperatures jump up quickly or rise above 75 o F, so knowing air temperature can help you get out to harvest them before you lose your crop.
Wind Direction and Speed
Tracking the direction and speed of the wind in your area can aid you in protecting your plants. Basic knowledge of the direction winds generally come from in your area is useful for trellising and placing plants in the landscape. It can also be helpful in positioning plants to help provide windbreaks for your home or resting spaces in your garden! Real-time wind information can help you plan for future events by becoming aware of patterns. Be sure to check weather forecasts to protect plants from cold or heavy winds predicted for your area before they arrive.
To find your weather data, Washington State University’s interactive weather map, AgWeatherNet, is a great tool for all of the above real-time soil and weather checks plus even more information about relative humidity, current rainfall, solar radiation and dewpoint for Washington State. This site is especially useful for the soil temperature map. Weather stations are installed at set points displayed on the map and you can go back and forth between them to get real-time readings for an area closest to your garden. In Seattle, the Center for Urban Horticulture (#43) hosts the weather station near Union Bay. Outside of Seattle, WSU has a station based at 21 Acres in Woodinville (#44) and in Snohomish (also #44). If you register on the site you can access even more information about rainfall, irrigation needs, wind chills, crop and disease models and more.
NOAA’s Climate Prediction Center also offers a series of maps, graphs and pages that show precipitation, temperature, drought, snow cover and more in real-time and predictive forms. From the main page you can look at weather forecasts for anywhere from six days to three months to help you plan.
For a look at what soil temperatures are ideal for seed germination visit this Oregon State University soil temperature fact sheet.
Climate Data Tables
Frost and Freeze Dates
NOAA also offers a chart showing the probability of frost or freeze dates for Washington. You can use this information to determine when your garden would be likely to encounter a 10% chance of seeing a 32o F temperature, helping you pinpoint an early, approximate date to plant cold-hardy veggies in the spring. You can also gamble and consider when there would be a 50% probability of seeing freezing temperatures to try an earlier planting, or at the end of the season check for when you might need to look out for a frost that could kill your basil. In contrast to the USDA map, which helps you choose plants that will survive your coldest temperatures, this chart helps you to plan when to plant in different seasons.
Average Seasonal Rainfall Data
Growing your familiarity with rainfall patterns allows you to know when you need to supplement rainfall with piped water, top garden beds with mulch to conserve water and how to set timers on irrigation systems so you do not waste water irrigating when it is not needed. You can also manage your water catchment systems more efficiently if you know when they will be likely to fill up so you can divert their overflow to your home’s drainage system and not cause flooding issues on your property. Perhaps our region’s obsession with rainfall is most apparent when it comes to the number of resources available to gather data about average rainfall per month in the Northwest. One simple display in Internet chart form can be found at this interactive weather database that allows you to focus on your city and to look at annual averages and month-by-month or seasonal average totals. You might be surprised to see that Seattle, on average, has 3 inches less rainfall than the national annual average! The database is searchable by city, which also allows you to pinpoint a radius around the city in question so you can see variations in the surrounding area.
To learn more about Pacific Northwest gardening and helpful resources, contact the Garden Hotline at (206) 633-0224 or www.gardenhotline.org. You can also find us on Facebook, Twitter, Pinterest and YouTube.
Laura Matter, Garden Hotline